Fact 1: The foreign-born share of the U.S. population has returned to its late-19th-century level.
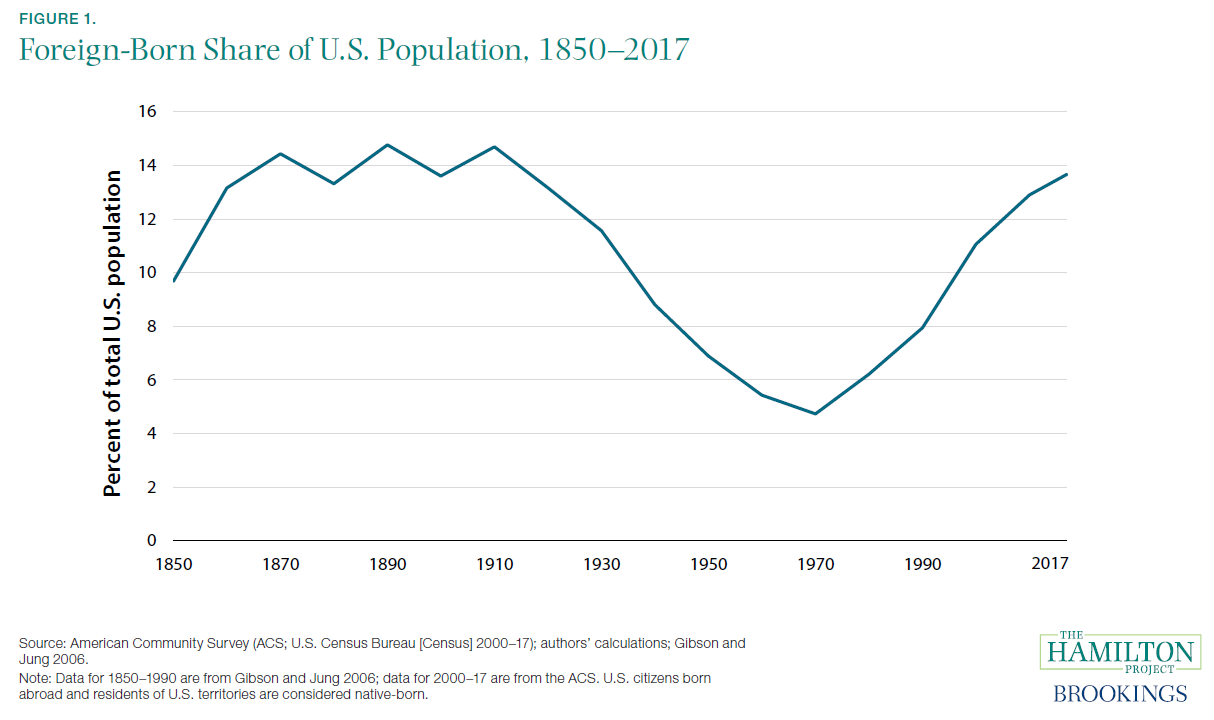
Immigrants have always been part of the American story, though immigration has waxed and waned over time. Immigration during the second half of the 19th century lifted the foreign-born share of the population to 14 percent. Starting in the 1910s, however, immigration to the United States fell precipitously, and the foreign-born share of the population reached a historic low of 4.7 percent in 1970.
This drop occurred in large part because of policy changes that limited immigration into the United States. Beginning with late-19th-century and early-20th-century policies that were directed against immigrants from particular countries—for example, the Chinese Exclusion Act of 1882—the federal government then implemented comprehensive national origin quotas and other restrictions, reducing total immigration inflows from more than 1 million immigrants annually in the late 1910s to only 165,000 by 1924 (Abramitzky and Boustan 2017; Martin 2010). Economic turmoil during the Great Depression and two world wars also contributed to declining immigration and a lower foreign-born fraction through the middle of the 20th century (Blau and Mackie 2017).
In the second half of the 20th century, a series of immigration reforms—including the 1965 Immigration and Nationality Act—repealed national origin quotas and implemented family reunification and skilled immigration policies. In 1986 amnesty was provided to many people who were living in the United States without documentation (Clark, Hatton, and Williamson 2007). Unauthorized immigration was estimated at about 500,000 in the early 2000s, but has since dropped sharply to a roughly zero net inflow (Blau and Mackie 2017).
The foreign-born fraction of the population rose steadily from 1970 to its 2017 level of 13.7 percent. From 2001–14, legal immigration rose to roughly 1 million per year, marking a return to the level of the early 20th century, but now representing a much smaller share of the total U.S. population. Today, there is a wide variation of the foreign-born population across states, ranging from under 5 percent in parts of the Southeast and Midwest to over 20 percent in California, Florida, New Jersey, and New York (Bureau of Labor Statistics [BLS] 2017; authors’ calculations).
Fact 2: The rising foreign-born share is driven by both immigration flows and low fertility of native-born individuals.
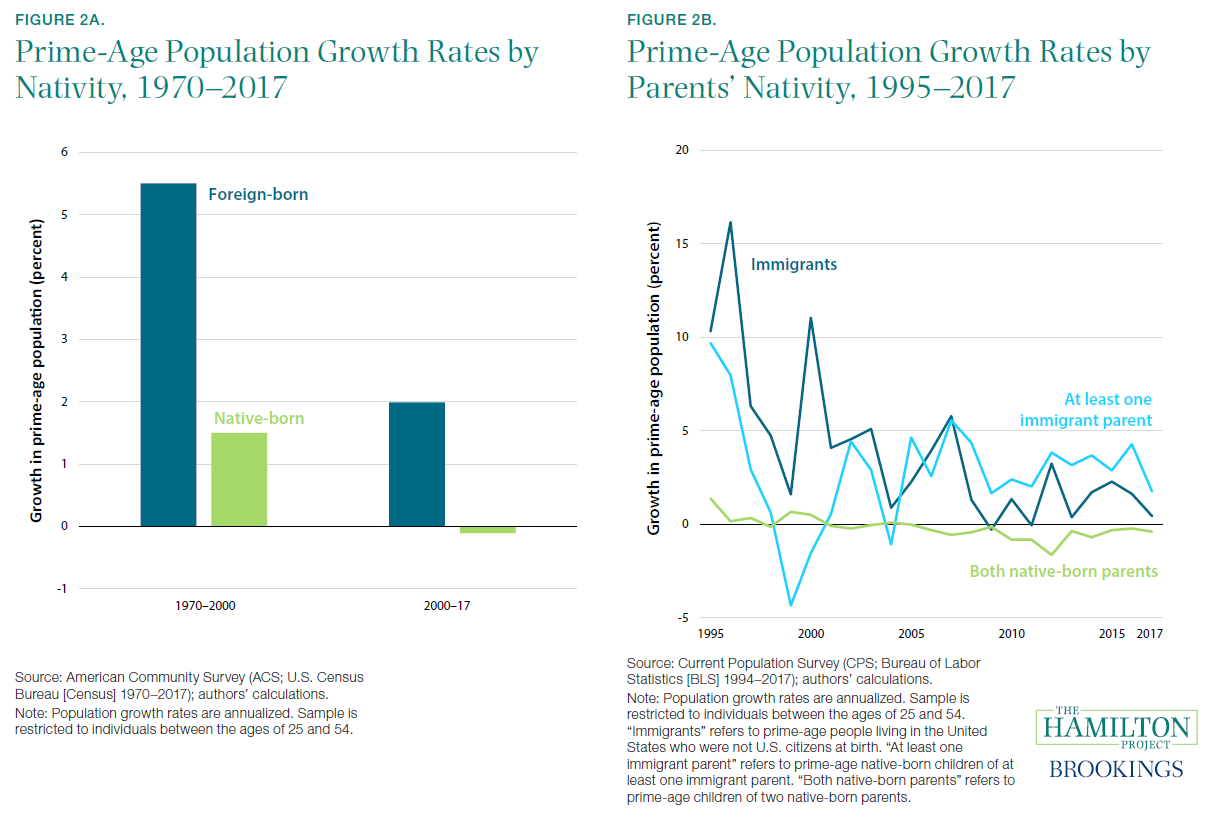
Though the foreign-born fraction has risen to its late-19th-century levels, the net migration rate is just half the level that prevailed around 1900 (Blau and Mackie 2017). With declining native-born population growth in recent years, even a diminished level of net migration has been enough to raise the foreign-born fraction (see figure 2a).
Figure 2b shows that recent growth in the number of prime-age children of immigrants has continued at more than 3 percent, supporting overall U.S. population growth. By contrast, the population growth rate of prime-age children of native parents has fallen from an average of 0.2 percent over the 1995–2005 period to an average of –0.5 percent over the 2006–17 period. The population growth of first-generation immigrants remains relatively high—1.8 percent on average from 2006 to 2017—but has fallen as net migration has slowed. Thus, the continued rise of the foreign-born share of the population since 1990 does not reflect a surge in immigration but rather a slowing migration rate combined with slowing growth in the population of children of natives.
From 1960 to 2016 the U.S. total fertility rate fell from 3.65 to 1.80 (World Bank n.d.). Demographers and economists believe that this decline was driven by a collection of factors, including enhanced access to contraceptive technology, changing norms, and the rising opportunity cost of raising children (Bailey 2010). As women’s labor market opportunities improve, child-rearing becomes relatively more expensive. Feyrer, Sacerdote, and Stern (2008) note that in countries where women have outside options but men share little of the child-care responsibilities, fertility has fallen even more.
Population growth is important for both fiscal stability and robust economic growth. Social Security and Medicare become more difficult to fund as the working-age population declines relative to the elderly population. (See fact 11 for a broader discussion of immigrants’ fiscal impacts.) Moreover, overall economic growth depends to an important extent on a growing labor force (see fact 8).
Fact 3: About three-quarters of the foreign-born population are naturalized citizens or authorized residents.
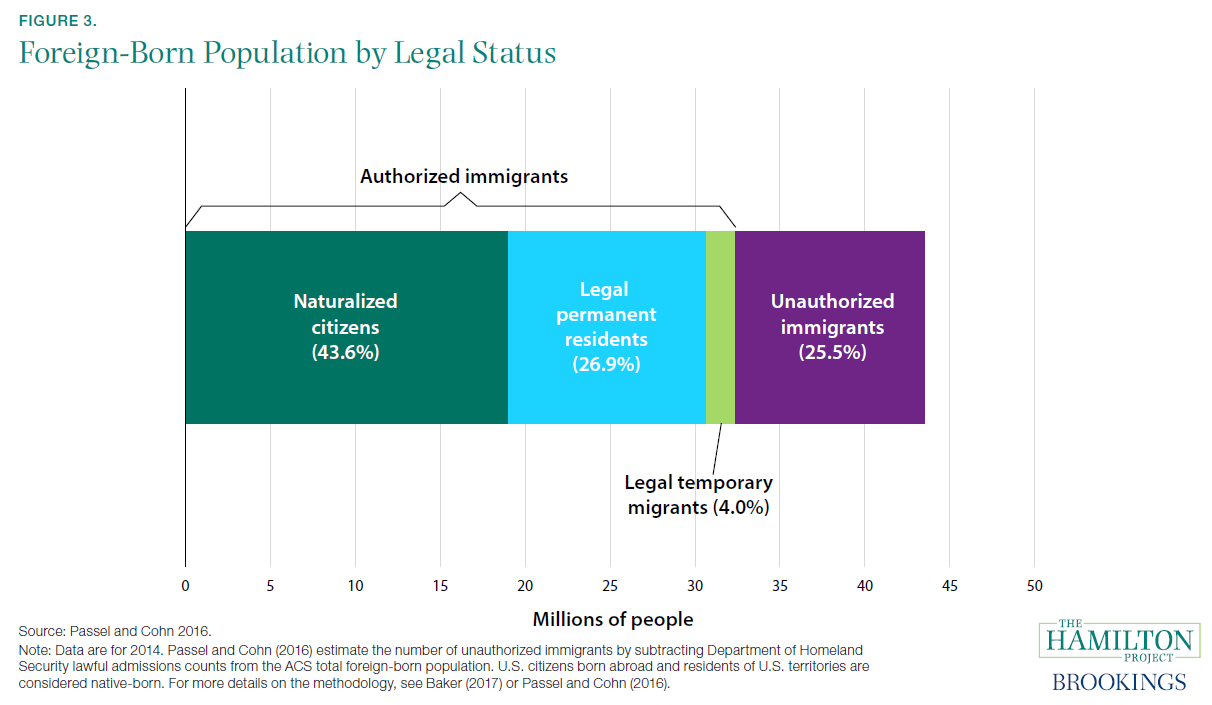
There are many ways in which immigrants come to the United States and participate in this country’s economic and social life. As of 2014 many in the foreign-born population had achieved U.S. citizenship (43.6 percent), while others had legal permanent resident status (26.9 percent), and still others were temporary residents with authorization to live in the country (4.0 percent). The remaining 25.5 percent of foreign-born residents are estimated to be unauthorized immigrants, as shown in figure 3. This is down from an estimated 28 percent in 2009 (Passel and Cohn 2011).
Unauthorized immigrants are the focus of intense policy and research attention. Some characteristics of these immigrants may be surprising: for example, more than 75 percent of all unauthorized immigrants have lived in the United States for more than 10 years. This marks a sharp increase from 2007, when an estimated 44.5 percent were at least 10-year residents. Moreover, only 18.9 percent of unauthorized immigrants are estimated to be 24 or younger, and 75.1 percent are in the prime working-age (25–54) group (Baker 2017).
There has also been special policy attention paid to those who entered the United States as children, including the Deferred Action for Childhood Arrivals (DACA) policy introduced in 2012 to allow temporary partial legal status to those who came to the United States as children, who are now 15–31 years old, who have committed no crimes, and who have been in the United States continuously since 2007. Roughly 800,000 people have used the program and estimates suggest 1.3 million were eligible (about 10 percent of the undocumented population) (Robertson 2018). Other proposed legislation—the American Hope Act—could affect as many as 3.5 million people (a third of the undocumented population) (Batalova et al. 2017).
The terms of immigrants’ residency are important for their labor market outcomes, and potentially for the impacts they have on native-born workers. Without authorized status and documentation, foreign-born residents likely have little bargaining power in the workforce and are exposed to a higher risk of mistreatment (Shierholz 2018).
Fact 4: 80 percent of immigrants today come from Asia or Latin America, while in 1910 more than 80 percent of immigrants came from Europe.
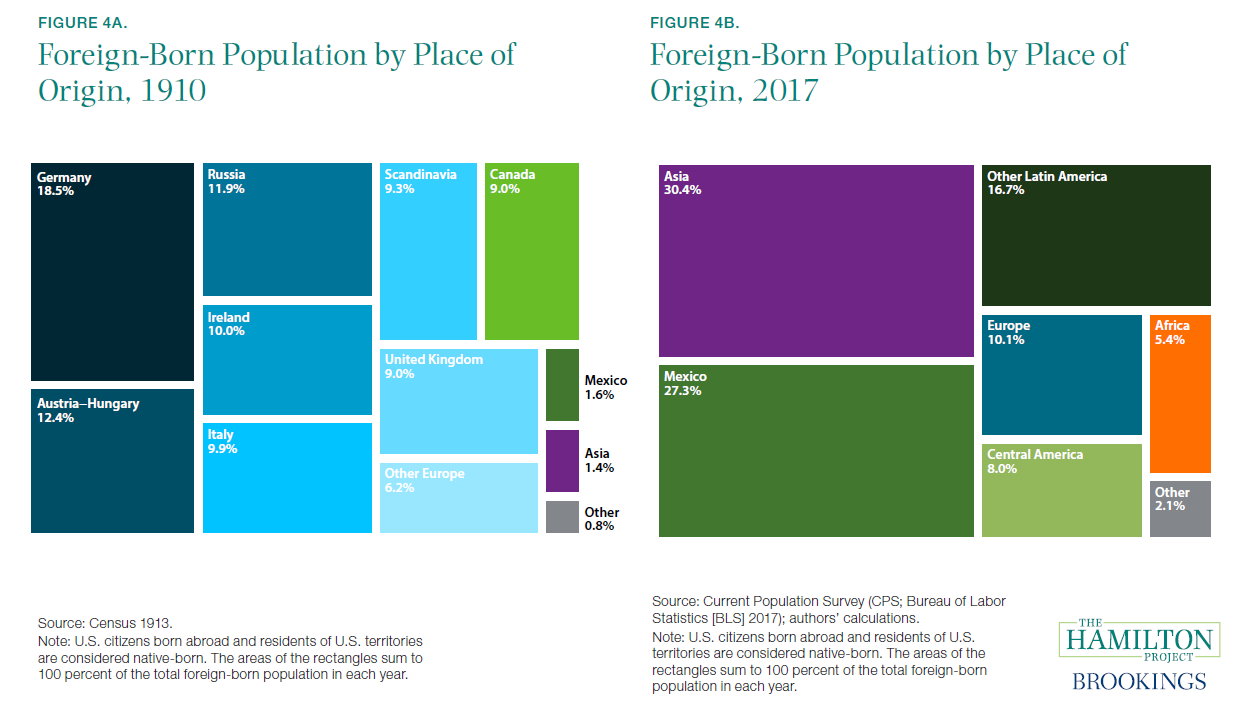
The countries of origin of immigrants to the United States have changed dramatically over the past century. Figure 4a shows that in the early 20th century the overwhelming majority of migrants entering the United States came from Europe. (The areas of the rectangles sum to 100 percent of the total foreign-born population in each year.) Although immigrants were predominantly from Western Europe, significant numbers arrived from Eastern Europe and Scandinavia as well. Today, the makeup of U.S. immigrants is much different: nearly 60 percent of the foreign-born emigrated either from Mexico (which accounted for only 1.6 percent of the foreign-born in 1910) or Asian countries (which accounted for only 1.4 percent in 1910).
India and China now account for the largest share (6.5 and 4.7 percent of all immigrants, respectively) among Asian immigrants, while El Salvador (3.4 percent) and Cuba (2.9 percent) are the primary origin countries in Latin America (after Mexico). As of 2017 immigrants from Germany account for the largest share of European immigrants (only 1.1 percent of all immigrants).
While the countries of origin may be different, there is some similarity in the economic situations of the origin countries in 1910 and today. GDP per capita of Ireland and Italy in 1913 were 45.4 and 33.7 percent, respectively, of U.S. per capita income in 1913, but today Western European GDP per capita is much closer to the U.S. level.[2] In 2016 Mexico’s per capita income was 29.8 percent of per capita income in the United States (Bolt et al. 2018). Then as now large numbers of immigrants were drawn to relatively strong economic opportunities in the United States (Clark, Hatton, and Williamson 2007).
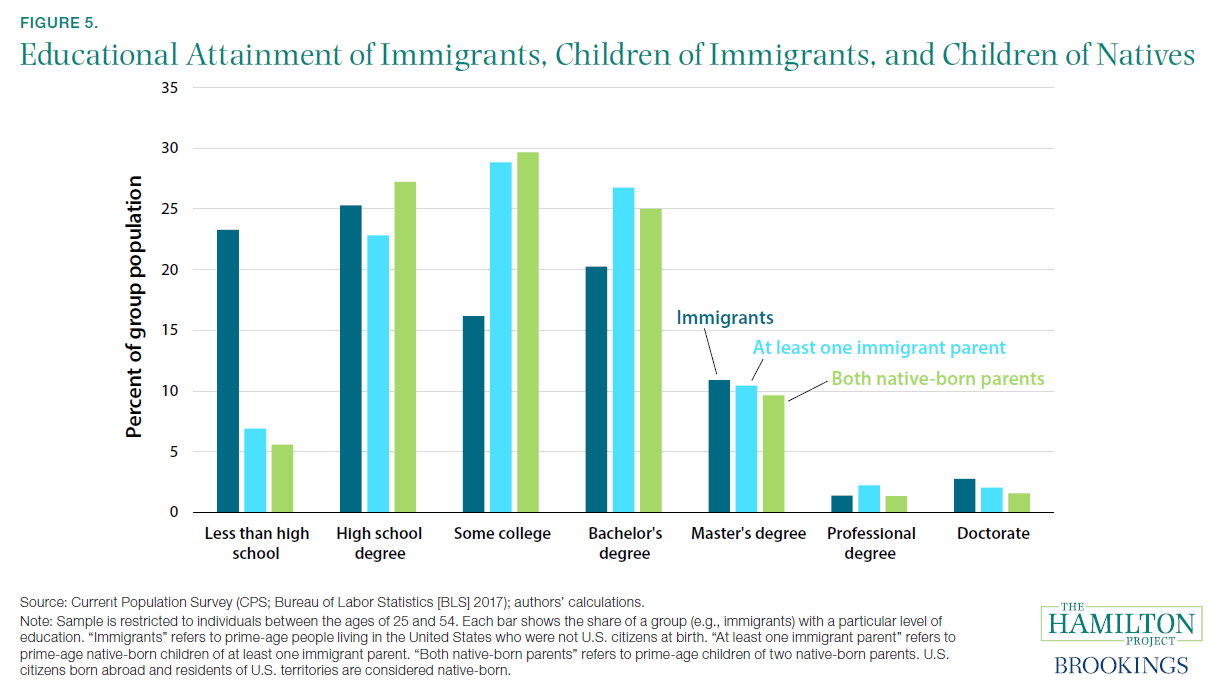
Fact 5: Immigrants are 4 times more likely than children of native-born parents to have less than a high school degree, but are almost twice as likely to have a doctorate.
The educational attainment of immigrants is much more variable than that of native-born individuals: there are more immigrants with less than a high school degree, but also more immigrants with a master’s degree or doctorate (relative to children of native-born parents), as shown in figure 5. This reflects the diversity of background that characterizes immigrants. Of all prime-age foreign-born persons in the United States with a postsecondary degree, 58.0 percent are from Asian countries, while 51.2 percent of all prime-age foreign-born persons with a high school degree or less are from Mexico (BLS 2017; authors’ calculations).
Immigrants to the United States are likely more positively selected on education and prospects for labor market success relative to nonimmigrants (Abramitzky and Boustan 2017; Chiswick 1999). This selection may have increased since 2000, with disproportionate growth in the highly educated foreign-born population (Peri 2017). A few features of the United States contribute to this tendency: first, the relatively limited social safety net available to immigrants makes the United States a less attractive destination for those with poor labor market prospects. Second, the United States is characterized by more wage inequality than many alternative destinations, with higher rewards available for high-skilled than for low-skilled workers. Third, the high cost of migration (due in large part to the physical distance separating the United States from most countries of origin) discourages many would-be immigrants who do not expect large labor market returns (Borjas 1999; Clark, Hatton, and Williamson 2007; Fix and Passel 2002).
Regardless of the characteristics of their parents, children of immigrants tend to attain educational outcomes that are like those of natives, but with higher rates of college and postgraduate attainment than observed for children of natives (Chiswick and DebBurman 2004).[3] For example, figure 5 shows that children of immigrants receive all degrees at roughly the rate of children of native parents, though the former have a slightly higher propensity to have either less than a high school degree or an advanced degree.
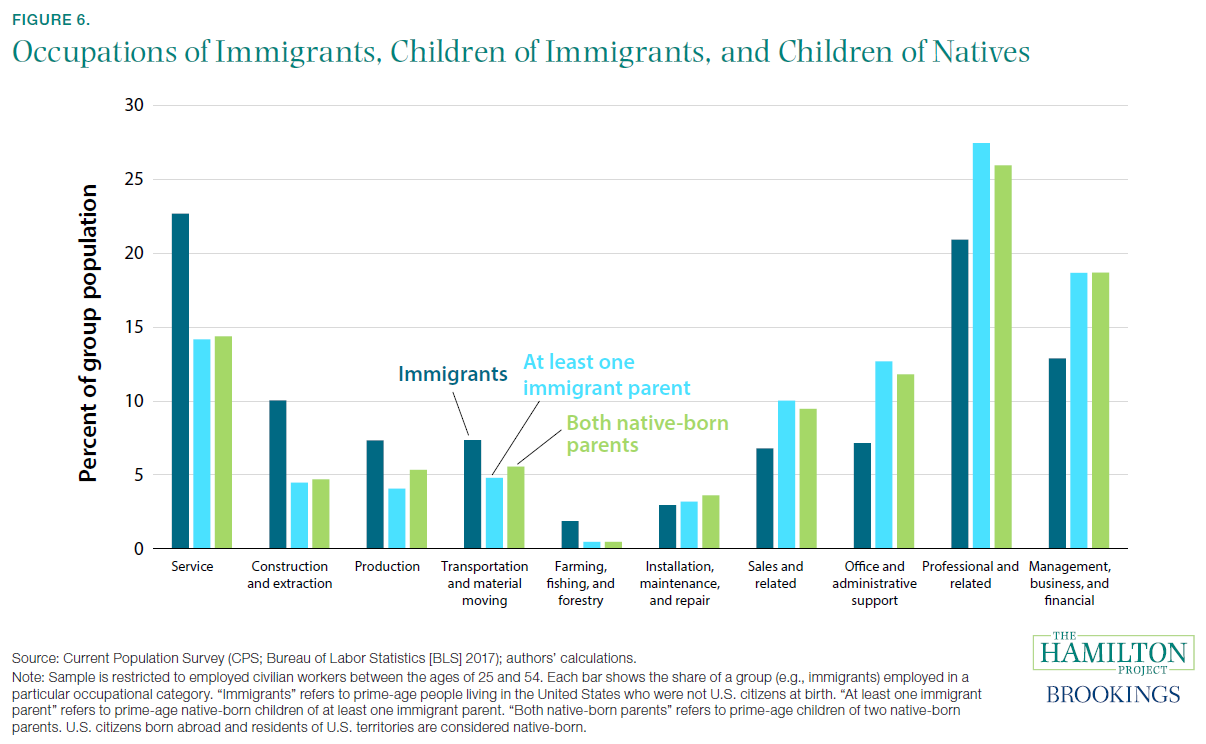
Fact 6: Immigrants are much more likely than others to work in construction or service occupations, but children of immigrants work in roughly the same occupations as the children of natives.
Differences in educational outcomes for foreign-born and native-born Americans are accompanied by occupational differences. The dark blue and light green bars in figure 6 show the fraction of immigrant workers and children of native-born workers, respectively, in a given occupational group. Immigrant workers are 39 percent less likely to work in office and administrative support positions and 31 percent less likely to work in management, while being 113 percent more likely to work in construction.
At the same time, immigrant workers accounted for 39 percent of the 1980–2010 increase in overall science, technology, engineering, and mathematics (STEM) employment, rising to 29 percent of STEM workers in 2010. By contrast, high-skilled native-born workers tended to enter occupations that require more communications and interpersonal skills (Jaimovich and Siu 2017). Among high-skilled immigrants, degree of English proficiency predicts occupational choice (Chiswick and Taengnoi 2008).
Another barrier to entry in some occupations consists of occupational licensing requirements, which can necessitate that immigrants engage in costly duplication of training and experience (White House 2015).
The gaps shown in figure 6 tend to diminish across generations. There are almost no appreciable differences in occupations between the children of immigrants and children of natives.
The entrepreneurial behavior of foreign- and native-born individuals also appears to be similar. While immigrants are more likely to be self-employed, they are not more likely to start businesses with substantial employment: immigrant workers at each education level are roughly as likely as native-born people to own businesses that employ at least 10 workers (BLS 2017; authors’ calculations).
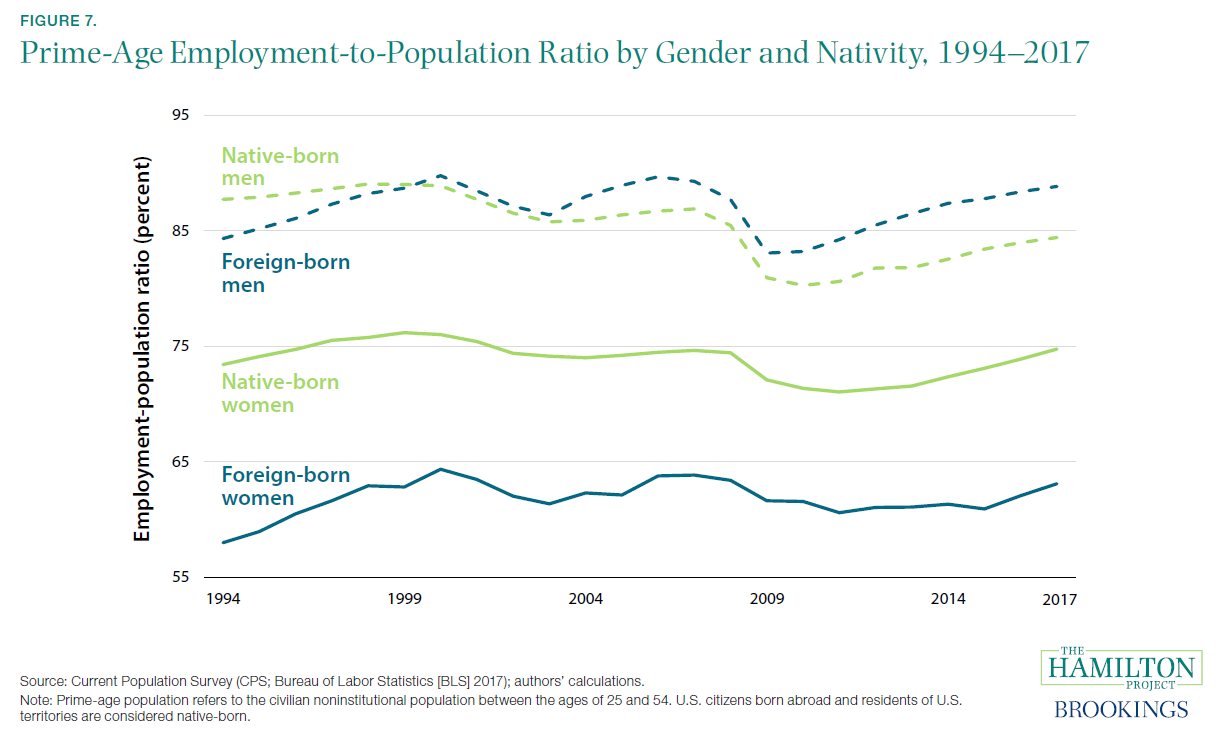
Fact 7: Prime-age foreign-born men work at a higher rate than native-born men, but foreign-born women work at a lower rate than native-born women.
Immigrants 16 and older work at a higher rate than native-born individuals (BLS 2017; authors’ calculations), but this belies sharp differences by age and gender, and we therefore focus on prime-age men and women separately. In 2017 foreign-born prime-age (25–54) men worked at a rate 3.4 percentage points higher than native-born prime-age men, while foreign-born prime-age women worked at a rate 11.4 percentage points lower than native-born prime-age women. For undocumented immigrants, this divergence between male and female employment is even more pronounced (Borjas 2017).
Women—whether foreign- or native-born—face large economic, policy, and cultural obstacles to employment (Black, Schanzenbach, and Breitwieser 2017). These obstacles may be larger for foreign-born women than for natives. Moreover, some immigrants come from cultures where women are less likely to work outside the home (Antecol 2000).
Figure 7 shows how foreign- and native-born employment rates have evolved over the past 20 years. The relatively stable levels of foreign-born employment reflect the offsetting forces of rising labor force participation for a given cohort as it spends more time in the United States as well as the arrival of new cohorts of immigrants. For both men and women immigrants, hours worked and wages tend to improve quickly upon entry to the United States (Blau et al. 2003; Lubotsky 2007).
Employment rates for low-skilled foreign-born individuals are considerably higher than those of natives. For example, 72.8 percent of foreign-born prime-age adults with a high school degree or less are employed (men and women combined), as compared to 69.5 percent for their native-born counterparts. The gap is much larger for those without a high school education: 70.3 percent of the foreign-born are employed and only 53.1 percent of the native-born are employed (BLS 2017; authors’ calculations).
Fact 8: Output in the economy is higher and grows faster with more immigrants.
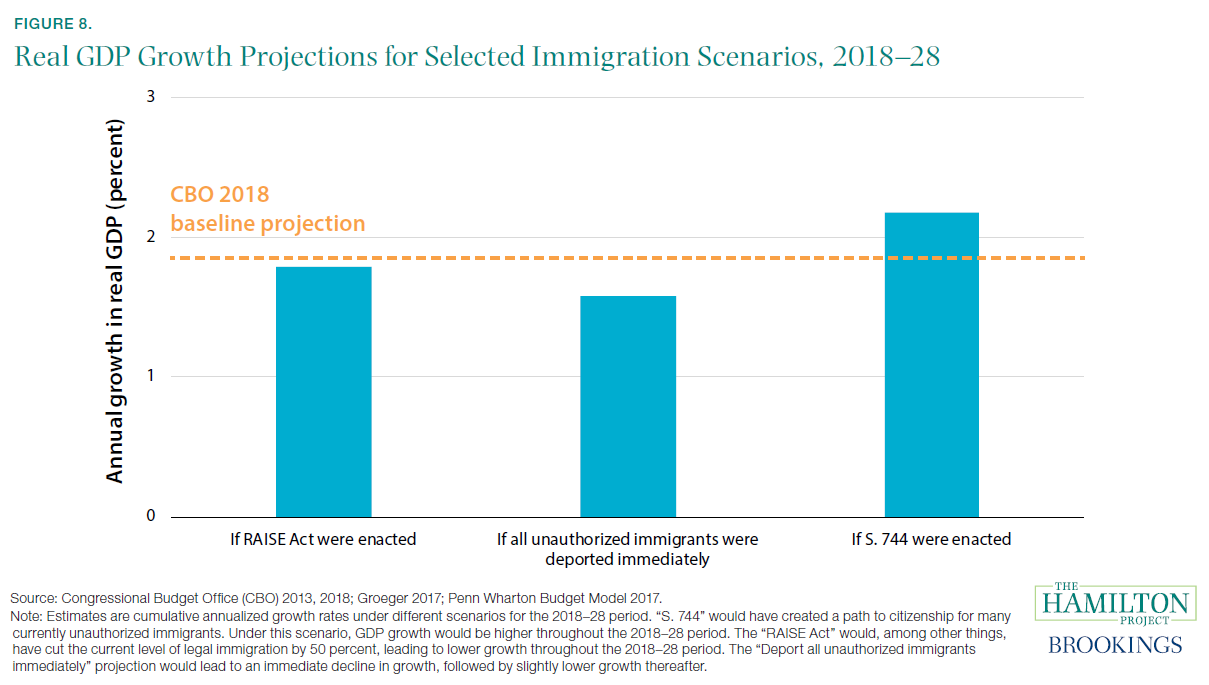
There is broad agreement among researchers and analysts that immigration raises total economic output (Borjas 2013; Congressional Budget Office [CBO] 2013). By increasing the number of workers in the labor force, immigrants enhance the productive capacity of the U.S. economy. One estimate suggests that the total annual contribution of foreign-born workers is roughly $2 trillion, or about 10 percent of annual GDP (Blau and Mackie 2017 citing Borjas 2013); the contribution of unauthorized immigrants is estimated to be about 2.6 percent of GDP (Edwards and Ortega 2016; authors’ calculations). As shown in figure 8, providing documented status to many current unauthorized immigrants (which should increase their productivity by allowing better job matching) and allowing more immigration would increase annual GDP growth by 0.33 percentage points over the next decade, while removing all current unauthorized immigrants would lower annual GDP growth by 0.27 percentage points during that same period (CBO 2013, 2018; Penn Wharton Budget Model 2017).
The economic effects of new workers are likely different over the short and long run. In the short run, a large increase or decrease in the number of immigrants would likely cause disruption: an increase could overwhelm available infrastructure or possibly put downward pressure on wages for native-born workers until capital accumulation or technology usage can adjust (Borjas 2013), while a decrease could harm businesses with fixed staffing needs, or lead to underutilization of housing and other similar capital (Saiz 2007; White House 2013).
Immigrants and natives are not perfectly interchangeable in terms of their economic effects: immigrants bring a somewhat different mix of skills to the labor market than do native workers, as detailed previously in this document. High-skilled immigration is particularly likely to increase innovation (see fact 10). In addition to these supply-side effects, immigrants also generate demand for goods and services that contribute to economic growth.
However, these positive impacts on innovation and growth do not necessarily mean that additional immigration raises per capita income in the United States (Friedberg and Hunt 1995). For example, if immigrant workers were on average less productive than native-born workers, additional immigration would reduce per capita GDP while increasing total economic output. Similarly, immigration may or may not lead to improved outcomes for native workers and for U.S. government finances; we discuss both concerns in subsequent facts. Most estimates suggest that immigration has a small positive impact on GDP over and above the income of immigrants themselves (Blau and Mackie 2017; Borjas 2013).
Fact 9: Most estimates show a small impact of immigration on low-skilled native-born wages.
It is uncontroversial that immigrants increase both the labor force and economic output. However, it is less obvious whether immigrants might lower wages for some native-born workers (Friedberg and Hunt 1995). In particular, low-wage native-born workers might be expected to suffer from the increased labor supply of low-skilled competitors from abroad, given that many immigrants tend to have lower skills than the overall native population (see figure 5).
Other adjustments could mute this impact. Firms could rearrange their operations to accommodate more workers and produce proportionally greater output, particularly over the long run (Friedberg and Hunt 1995). Firms appear to adjust technology and capital based on immigration and the skill mix of the local population (Lewis 2011). Foreign-born and native-born workers may be imperfect substitutes, even when they possess similar educational backgrounds (Ottaviano and Peri 2012).
In addition, the impact of low-skilled immigrants may be diluted (i.e., shared across the entire national labor market) as native workers and firms respond by rearranging themselves across the rest of the country (Card 1990). Foreign-born workers appear to be especially responsive to economic shocks as they search for employment: Mexican low-skilled men are more apt to move toward places with improving labor market prospects (Cadena and Kovak 2016). Finally, immigrants—low-skilled or high-skilled—contribute to labor demand as well as labor supply to the extent that they consume goods and services in addition to becoming entrepreneurs (White House 2013).
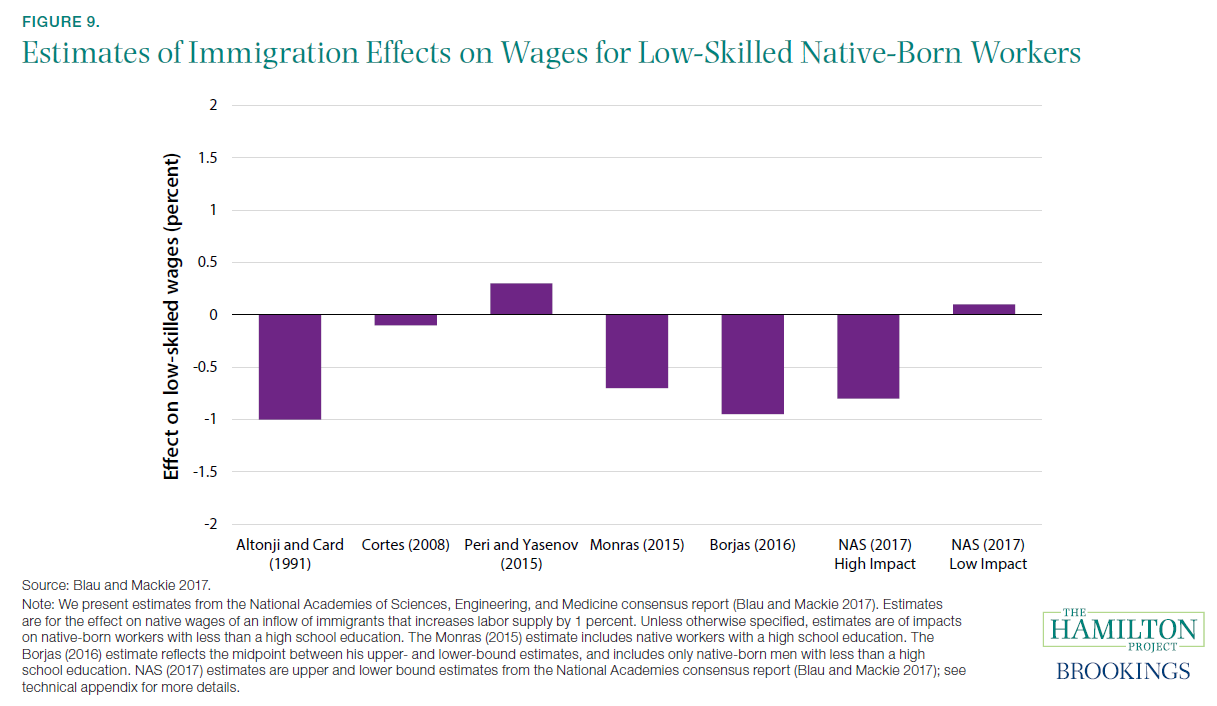
It is therefore an empirical question whether low-skilled immigration actually depresses wages for low-skilled natives. The consensus of the empirical literature is that this does not occur to any substantial extent (see figure 9, which presents estimates used in the National Academies of Sciences, Engineering, and Medicine consensus report). Most estimates in figure 9 show an impact on low-skilled native-born wages of 0 percent to –1 percent. Another recent estimate of the impact on low-skilled natives (Ottaviano and Peri 2012) estimated a slightly positive impact on wages (between 0.6 and 1.7 percent). Furthermore, the impacts on wages of native-born workers with more education are generally estimated to be positive, such that most estimates find the overall impact on native workers is positive (Blau and Mackie 2017; Kerr and Kerr 2011; Ottaviano and Peri 2012).
Fact 10: High-skilled immigration increases innovation.
As discussed in fact 6, the kind of work that immigrants do is often different than that of native-born workers. In particular, immigrants are more likely to possess college and advanced degrees, and more likely to work in STEM fields. This in turn leads to disproportionate immigrant contributions to innovation.
One useful proxy for innovation is the acquisition of patents. Immigrants to the United States tend to generate more patentable technologies than natives: though they constitute only 18 percent of the 25 and older workforce, immigrants obtain 28 percent of high-quality patents (defined as those granted by all three major patent offices). Immigrants are also more likely to become Nobel laureates in physics, chemistry, and physiology or medicine (Shambaugh, Nunn, and Portman 2017).
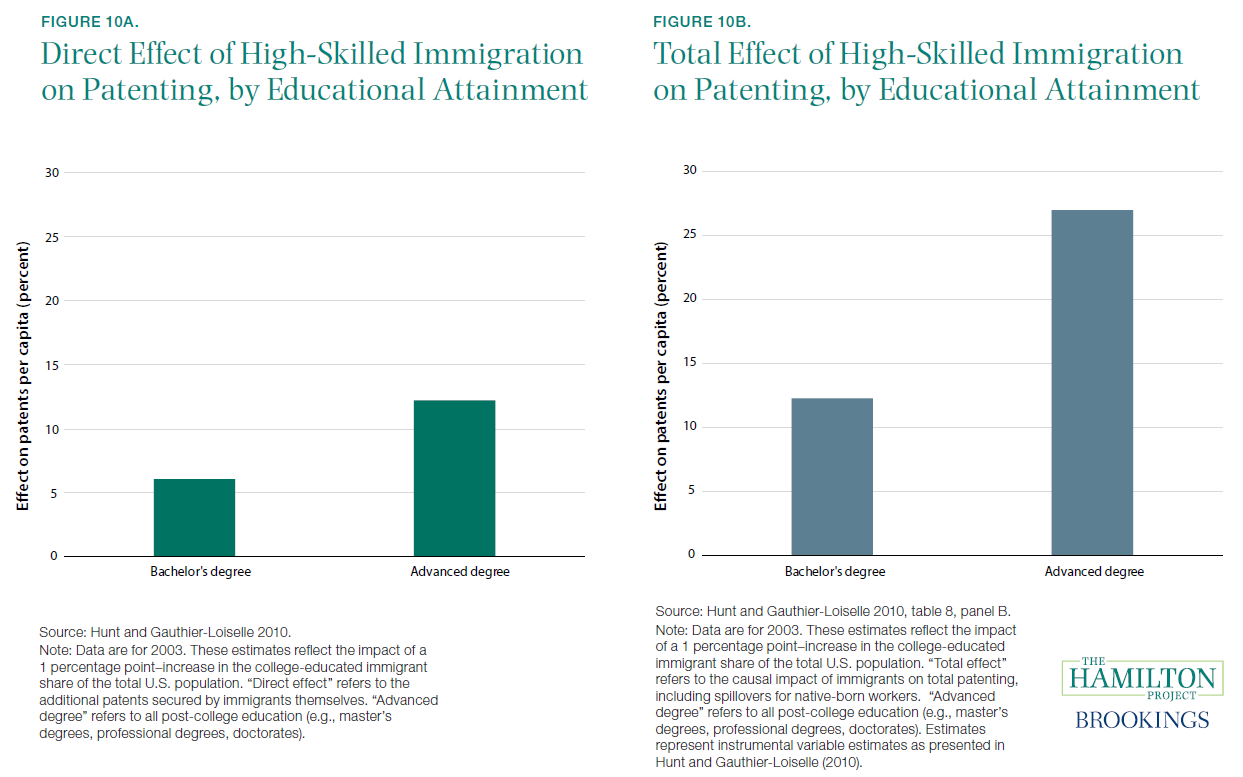
Presenting estimates from Hunt and Gauthier-Loiselle (2010), figure 10a shows the direct impact of high-skilled immigrants on patenting per capita based on their higher propensity to patent. Increasing the share of college-educated immigrants in the population by one percentage point increases patents per capita by 6 percent. This impact is roughly twice as large for those with advanced degrees.
Figure 10b shows the total impact—which includes both the direct impact as well as any spillovers to the productivity of native-born workers—of an increase in the high-skilled immigrant share of the population. Hunt and Gauthier-Loiselle find that spillovers are substantial and positive. A one percentage point–increase in the college-educated or advanced degree-holding immigrant shares of the U.S. population are estimated to produce a 12.3 percent or 27.0 percent increase in patenting per capita, respectively.
In an examination of foreign-born graduate students, Chellaraj, Maskus, and Mattoo (2008) also find positive spillovers for native-born innovation. Research examining short-run fluctuations in the number of H-1B visas similarly concludes that immigrants add to aggregate innovation, although estimates of spillovers for innovative activities of native-born workers are smaller or nonexistent (Kerr and Lincoln 2010).
Fact 11: Immigrants contribute positively to government finances over the long run, and high-skilled immigrants make especially large contributions.
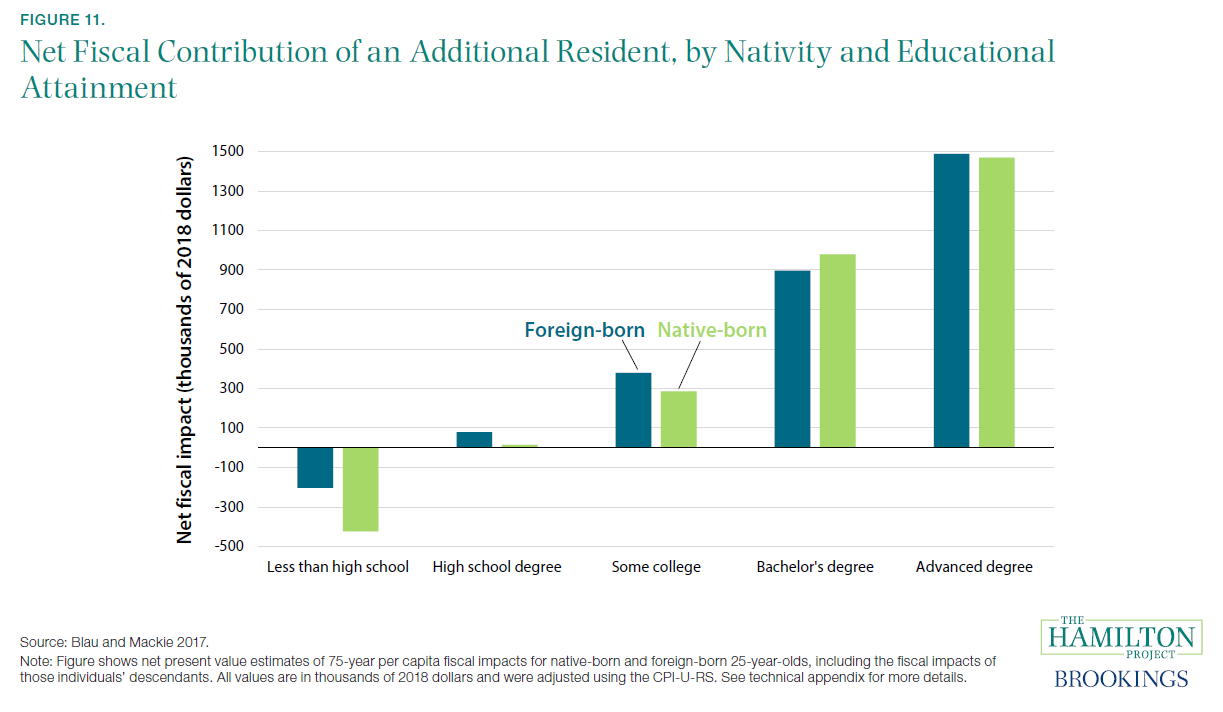
With its complicated system of taxes and transfers, the United States is affected in a variety of different ways by the arrival of immigrants. Figure 11 provides estimates of immigrants’ fiscal impacts (including the fiscal impacts of their descendants), shown separately by level of educational attainment. These estimates include direct spending on individuals through the social safety net or other programs as well as taxes paid. The estimates do not include public expenditures on categories like public safety, national defense, and interest on the debt, because these expenses do not necessarily increase as the population rises. If those expenses were included, the fiscal impact of each category of foreign-born and native-born workers would be more negative, but the overall pattern would remain the same.
Workers with more education and higher salaries tend to pay more taxes relative to their use of government programs, and that is reflected in the more-positive fiscal impacts of highskilled individuals. Looking separately at revenue and outlay implications, most of the variation in immigrant fiscal impact across education levels is due to differences in the amount of taxes paid (Blau and Mackie 2017, 444–60). Moreover, recent immigrants have tended to experience better labor market outcomes than the overall immigrant population; in part this is due to the more-recent arrivals being better educated, which leads to them having an even more-positive fiscal impact (Orrenius 2017).
Across the educational categories, the foreign-born population is estimated to have a slightly more-positive fiscal impact in nearly every category. For the foreign-born population as a whole, per capita expenditure on cash welfare assistance, Supplemental Nutrition Assistance Program (SNAP; formerly known as the Food Stamp Program), Supplemental Security Income (SSI), Medicaid, Medicare, and Social Security are all lower than for native-born individuals, even when restricting the comparison to age- and income-eligible individuals (Nowrasteh and Orr 2018).
Fact 12: Immigration in the United States does not increase crime rates.
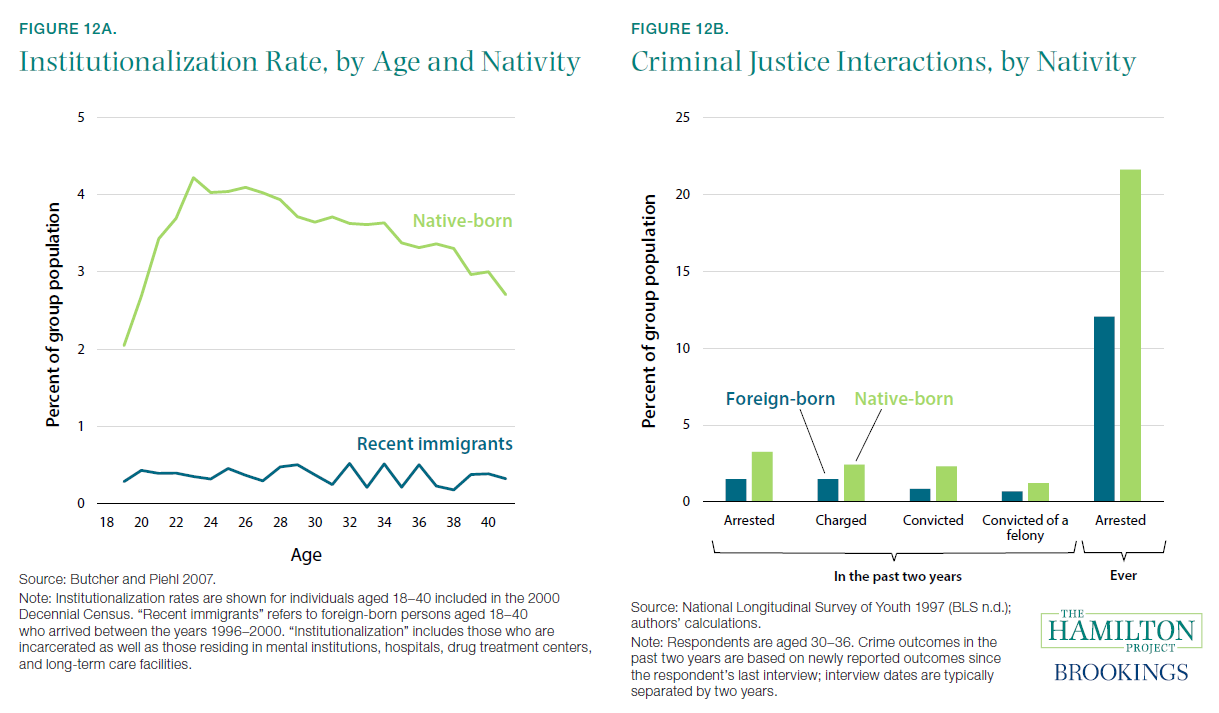
Immigrants to the United States are considerably less likely than natives to commit crimes or to be incarcerated. As shown in figure 12a, recent immigrants are much less likely to be institutionalized (a proxy for incarceration that also includes those in health-care institutions like mental institutions, hospitals, and drug treatment centers) at every age.
Why do immigrants have fewer interactions with the criminal justice system? Immigrants are subject to various kinds of formal and informal screening. In other words, institutions and incentives often cause the United States to receive migrants who are advantaged relative to their origin-country counterparts (Abramitzky and Boustan 2017) and less disposed to commit crimes. At the time of Butcher and Piehl’s analysis, deportation was not a major factor; rather, self-selection of low-crime-propensity immigrants into the United States appears to have been the driver (Butcher and Piehl 2007).[4]
There is an important caveat to this account: recent immigrants have had less time to be arrested and imprisoned in the United States than have natives. In other words, there may be a somewhat smaller gap in their criminal activity versus natives, but the U.S. criminal justice system has had less time to detain and incarcerate them (Butcher and Piehl 2007). Figure 12b therefore looks more specifically at the criminal justice interactions of native-born and foreign-born adults over a narrower window of time. It shows that 30- to 36-year-old immigrants are less likely to have been recently arrested, incarcerated, charged, or convicted of a crime when compared to natives, confirming the broader pattern of figure 12a. Research examining quasi-random variation in Mexican immigration has also found no causal impact on U.S. crime rates (Chalfin 2014).
In addition to the broader question of how immigrants as a group affect crime and incarceration rates, it is important to understand how changes in the legal status of immigrants can affect criminal justice outcomes. Evidence suggests that providing legal resident status to unauthorized immigrants causes a reduction in crime (Baker 2015). This is associated with improvements in immigrants’ employment opportunities and a corresponding increase in the opportunity cost of crime. Conversely, restricting access to legal employment for unauthorized immigrants leads to an increased crime rate, particularly for offenses that help to generate income (Freedman, Owens, and Bohn 2018). In total, unauthorized immigration does not seem to have a significant effect on rates of violent crime (Green 2016; Light and Miller 2018).


